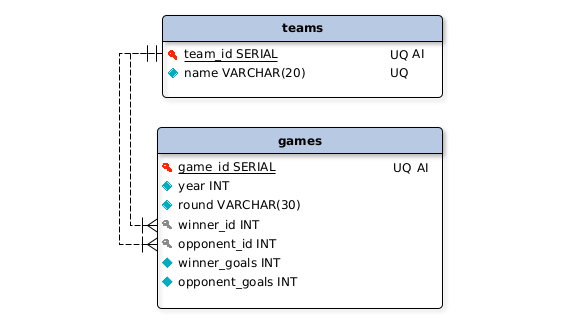
This project requires creating a Bash script that enters information from World Cup game into PostgreSQL, then query the database for useful statistics.
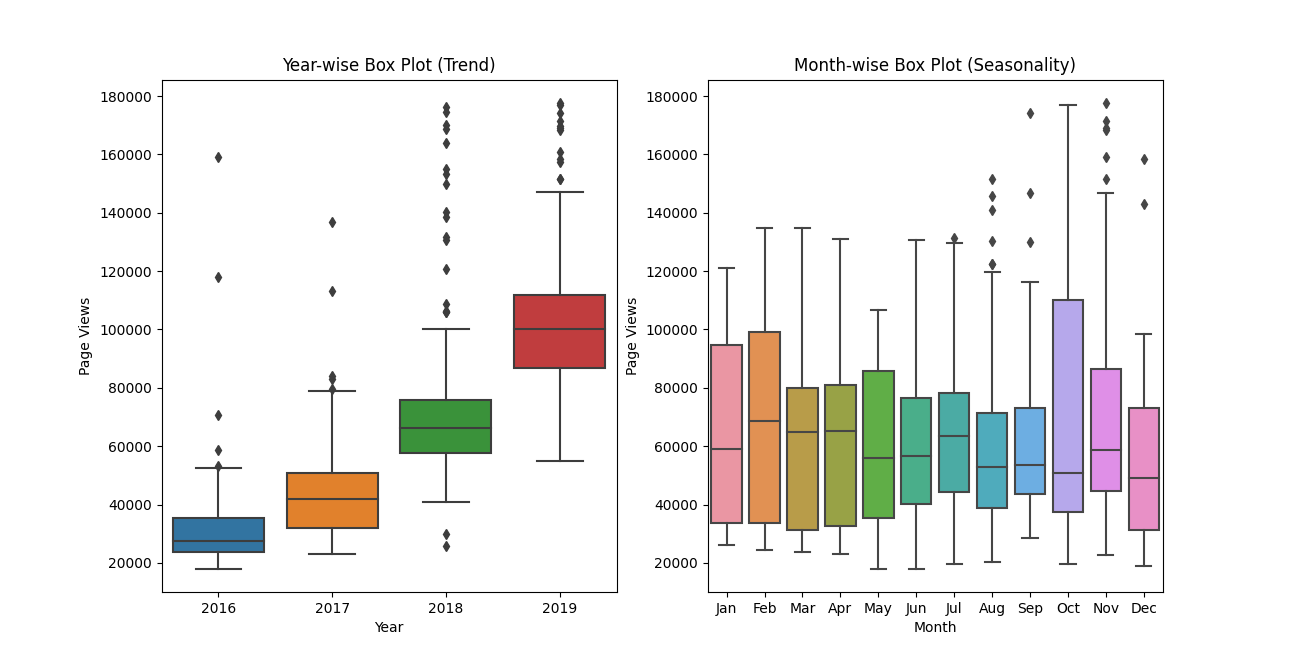
In this project, you will visualize time series data using a line char, bar chart, and box plots. You will use Pandas, Matplotlib, and Seaborn to visualize a dataset con- taining the number of page views each day on the free freeCodeCamp.org forum from 2016-05-09 to 2019-12-03. The data visualizations will help you understand the patterns in visits and identify yearly and monthly growth.
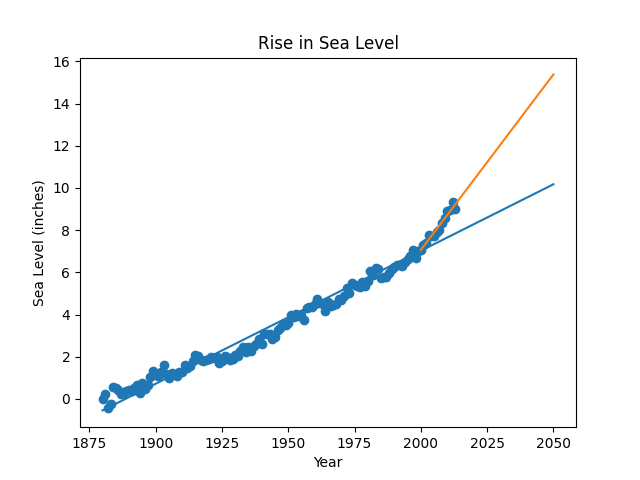
This project requires analyzing a dataset of the global average sea level change since 1880. Then, using the data to predict the sea level change through year 2050.
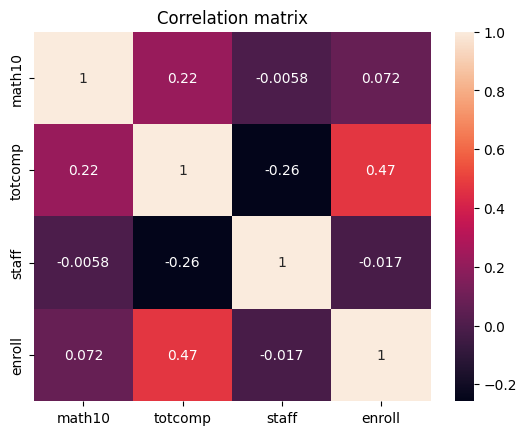
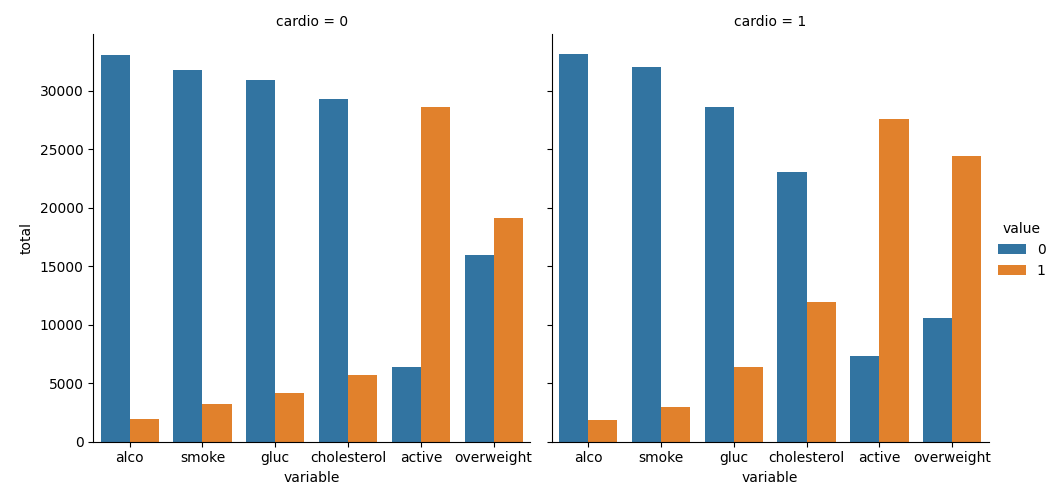
This project requires visualizing and making calculations from medical examination data using matplotlib, seaborn, and pandas. The dataset values were collected during medical examinations.
In this project, you will analyze demographic data using Pandas. You are given a dataset of demographic data that was extracted from the 1994 Census database.